Stackable
Now available: Managed Data Lakehouse → Sovereign, Compliant, Open Source. Try it free for 30 days.
Jetzt verfügbar: Managed Data Lakehouse → Souverän, Compliant, Open Source. 30 Tage kostenlos testen.
Real-time display of water levels
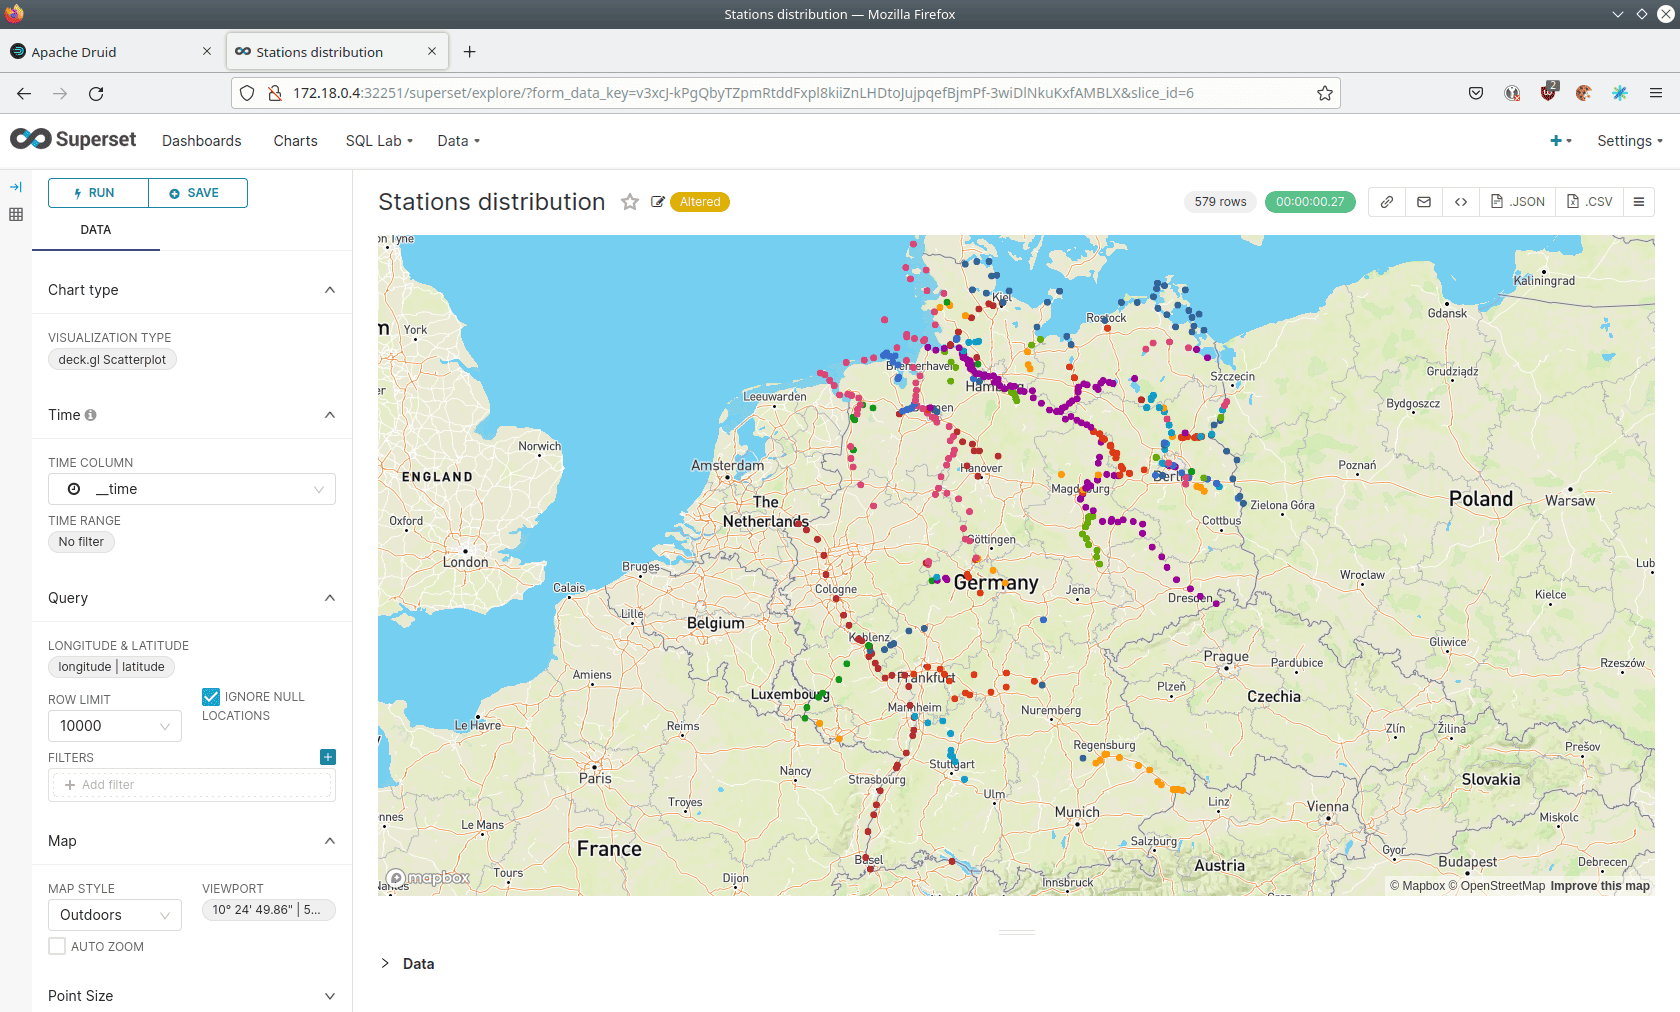
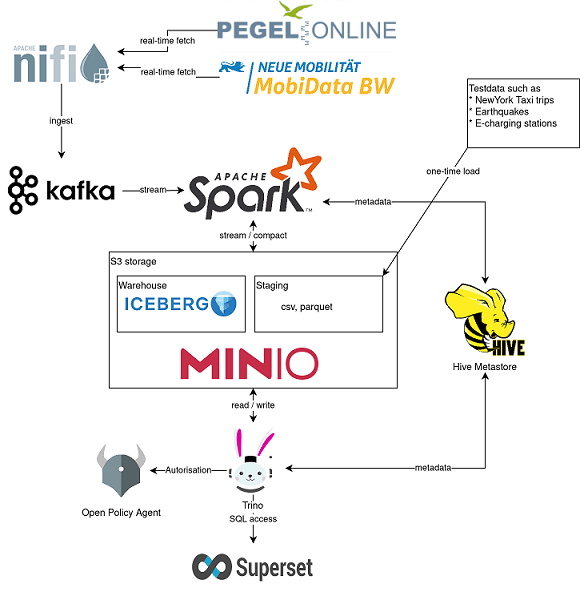
Near real-time river water levels across Germany: Apache NiFi pulls the Pegel Online API, streams through Apache Kafka, is ingested by Apache Druid and shown live in a Superset dashboard.
HOW TO START
With a Kubernetes cluster, run a single command:
Key Features
Real public data
Live measurements from German Pegel Online water-level stations.
Sub-second analytics
Druid answers time-series queries in milliseconds.
Backpressure-safe
Kafka buffers spikes between ingestion and storage.
Streaming ETL
NiFi to Kafka to Druid, continuously and without manual steps.
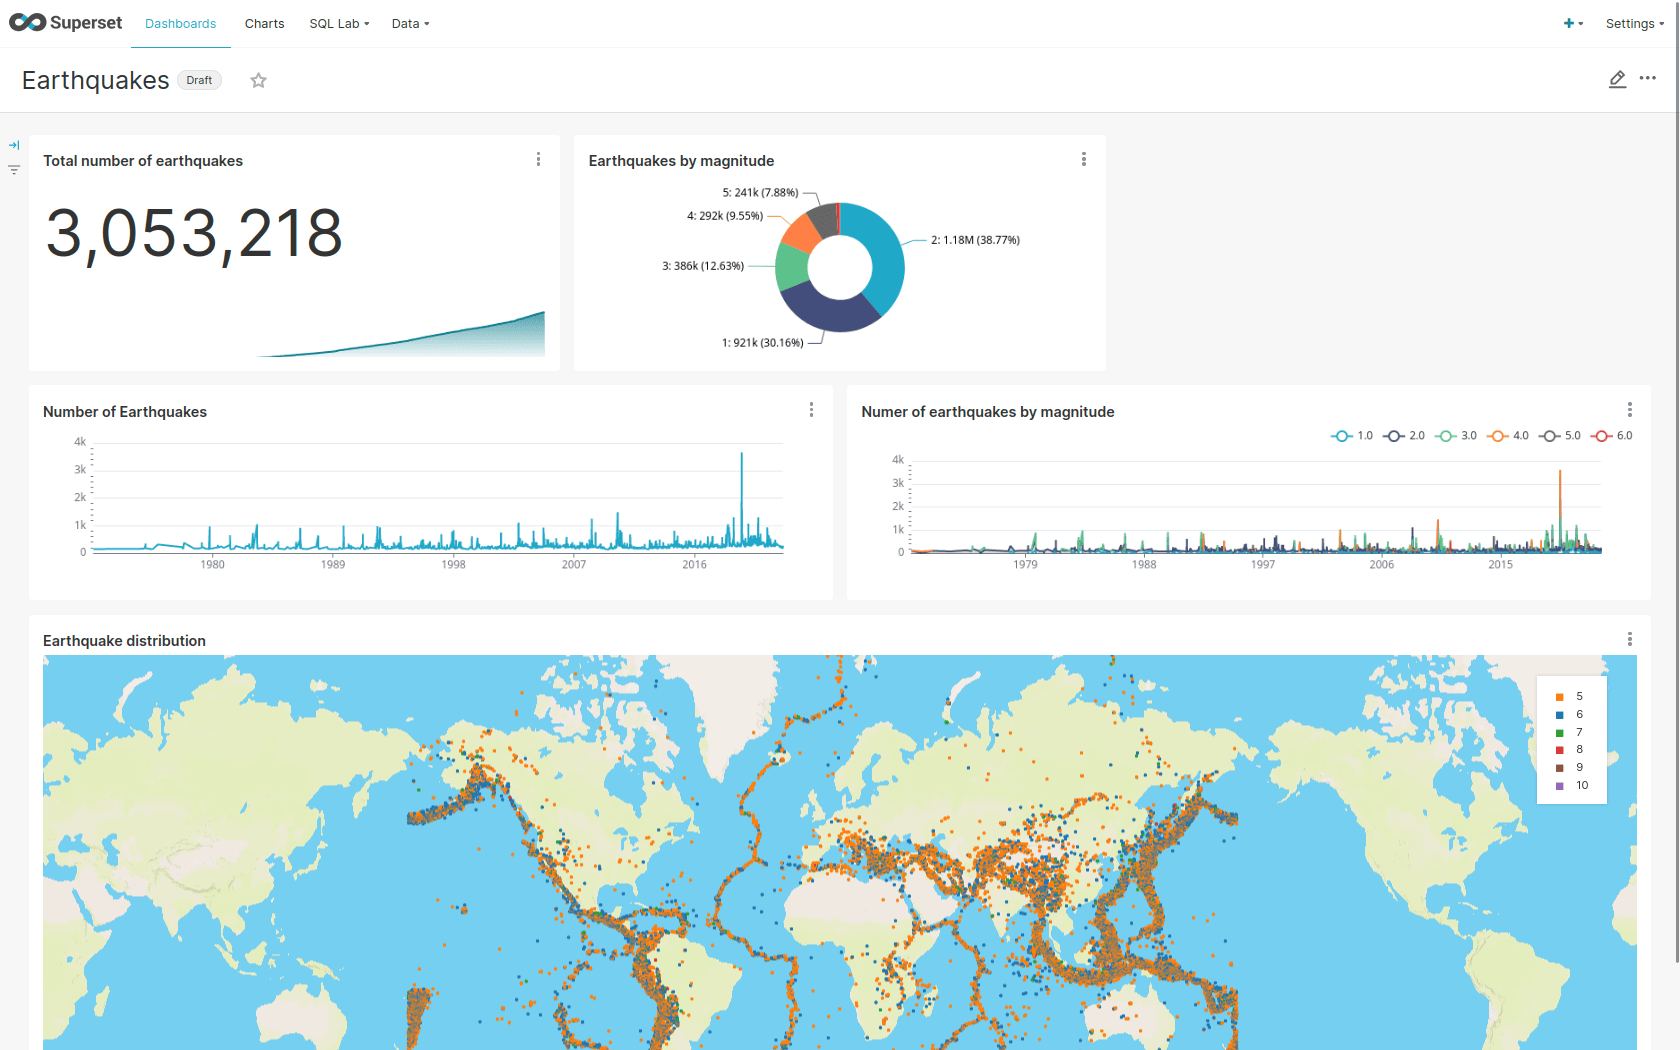
Live dashboards
Superset auto-refreshes as new measurements arrive.
Geospatial view
Stations plotted on a map alongside their readings.
Demo Components
Apache NiFi
Ingestion
Polls the Pegel Online API and publishes readings to Kafka.
Apache Kafka
Streaming
Durable event log buffering the measurement stream.
Apache Druid
Real-time OLAP
Ingests from Kafka and serves fast time-series queries.
Apache Superset
Dashboards
Live dashboard visualizing water levels across stations.
Demo Workflow
Installation
One command installs NiFi, Kafka, Druid and Superset.
Fetch from Pegel Online
NiFi calls the public API and publishes readings to Kafka.
Buffer in Kafka
Kafka retains the stream and smooths out spikes.
Ingest into Druid
Druid consumes the Kafka topic for real-time OLAP.
Watch it live
See water levels update in the Superset dashboard.
Stand up a real-time streaming analytics pipeline on public sensor data.